When we were just a small agency starting out, our dream was to work with the “big” clients, the ones who had real monthly marketing budgets. As our reputation grew and we built a great team with the internal processes necessary to scale up, we eventually started working with such clients.
And, let me tell you, it’s not easy! Unlike traditional marketing where you can create a newspaper ad or radio ad, launch it, and then just basically sit back and watch for the next 3 months, digital marketing efforts need constant monitoring and optimization, often on a daily basis.
And we’re not just looking for impressions here, but results. Again, unlike traditional marketing where the main KPI is usually impressions, we need to make sure the budget is well spent to get the results we’re looking for.
Pre-spend Audience Research
Now, some agencies will just start cranking out split tests and try to see what sticks. This is a waste of a client’s money and the hallmark of a lazy agency. Audiences need to be researched and identified before a single dime is invested into ad campaigns.
If we’re lucky, our client already has some good demographic and behavioral data around their customers. Then it’s just a simple matter of thoroughly interviewing the right client staff members to get the information we need.
However, we’ve sometimes found that who an organization thinks its customers are and who they actually are can be two very different things. In the digital world, we are focused on validating strategy. Focus groups and customers surveys can be very unreliable because what customers say they will do and what they actually do are also very different.
So we always do experiments with audiences and ads until assumptions are validated before scaling up a spend.
Just Who Is Our Target Audience?
OK, so getting back to the research. Let’s look at our client The Veterans Advocacy and Benefits Association. They had not previously done any Facebook advertising, so we needed to identify and validate target demographics.
We start by researching potential audiences. There are a couple ways to do that:
-
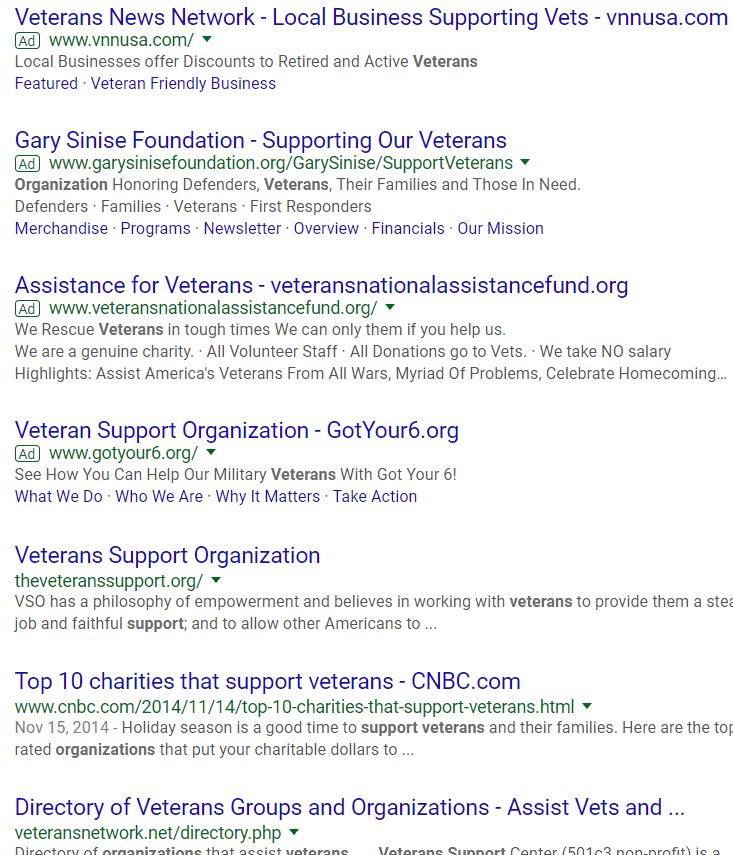
Simple Google Search:
Just explore around on the top ranking results for Google related to the client. In this case, Supporting Veterans.
We’ll research the first page of results and see if they also have a Facebook Page. It’s important for them to have a Facebook Page, because otherwise there is no way to target supporters or interested members of the site.
-
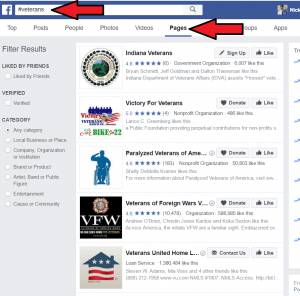
Hashtag Page Search on Facebook:
Search related hashtags by pages and people. Here, we use the obvious hashtag #veterans. We then click over to Pages and see what pages are being displayed. We can also do the same with people and see what pages they are posting on, other relevant hashtags they may be using, or just better understand what is important to this audience.
-
Use Facebook Graph Search
This is a great tool few people know exists. You can actually use Facebook search to find similar users by typing in something like “Interests liked by people who like Gary Sinise Foundation”. You’ll get a whole series of related interests, pages, and public posts to explore through.
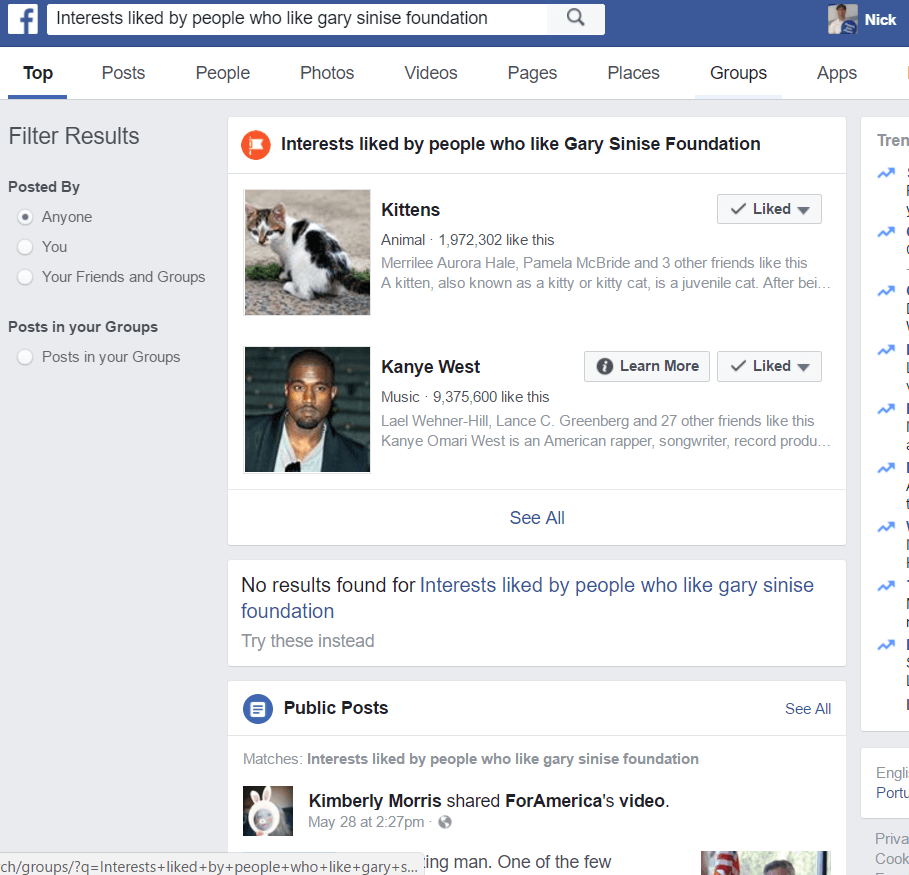
Now, these aren’t always great, like these people’s apparent affinity for Kanye West, but if you scroll through, you’ll often find some gems. -
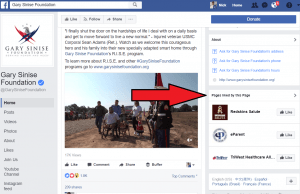
Check Liked by This Page:
Check go into a page and see what other pages they like. This is a pretty good indicator of other relevant groups.
-
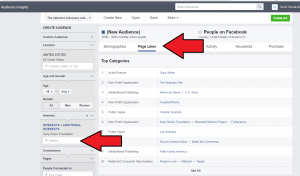
Audience Insights
Finally, you can also use Audience Insights which can give you great information on pages.Just type in the name of the Page into Interests and see what results populate.
Understanding the Value of Page Targeting
You’re not done yet. There is an incredibly important next step that will make or break your campaigns.
Obviously, you can target by various interests, demographics, and behaviors, but the page targeting we illustrated how to do above is much more effective.
Here’s why.
Page targeting allows you to identify engagement levels. Let’s take a look at the Gary Sinise Foundation Page we keep using as an example. Look at the number of fans on the page and then compare that to the average number of engagements with posts.
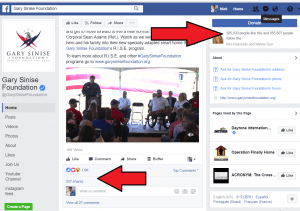
You can see that the page only has 365,033 likes. That’s actually pretty low for veteran page, as we’ll see shortly.
However, look at the post. 1.9K engagements and 227 shares! That’s some incredibly high engagement. If we then calculate the post engagement score (All reactions + comments + shares / total impressions), we get almost 12%. That is really really high. Most pages are in the 2-3% range, if that.
Those metrics were consistent for all posts on their page.
Let’s now take a look at Support Our Veterans Page.
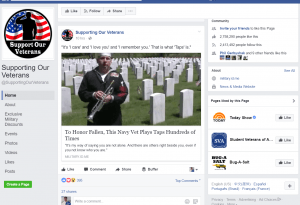
Nearly 3 million likes! That’s amazing, right? But wait. Look at the reactions and shares. Not event 400. Almost every post on the page was like this.
So Gary Sinise Foundation only had 360,00 some followers, but nearly 2,000 engagements on many posts. Support Our Veterans has nearly 3 million followers, but not nearly even a similar level of engagement.
So while Support Our Veterans may appear to be popular when looking at number of likes, it’s not a very engaged or active community.
This tells us that these followers are unlikely to take action. Whereas Gary Sinise Foundation followers are much more likely to.
So this is the main reason why we want to do our research well. It tells us not just who our target audience is, but which audiences are likely to act.
Round 1: The Split Testing Begins
Ok, so we’ve identified some very strong candidates in terms of related pages with high engagement levels and active audiences.
Now we need to test those out. Again, no point in wasting tons of money here. We’re just testing. $10 or 10,000 leads is the bare minimum we recommend for calling a split test winner just due to the amount of data really needed to be considered significant or predictive.
Facebook recommends a bare minimum of 8,000 impressions before making any decisions. We usually recommend at least $20. $10 could do it in a pinch, but often isn’t enough information. And if we’re going to scale up a $10,000 ad spend, I’d rather be confident than tentative in my choices as the wrong targeting can compound negatively over time.
We also recommend letting campaigns run for about 3 days. It’s not a necessity, but the fact is that not everyone is on Facebook all the time. So you want to spread your data out over a couple days and get multiple data points for main time frames before really making firm decisions.
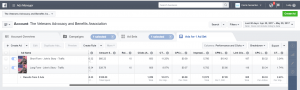
Below, you can see most of the 10 pages we identified when we did our initial research for this client. And you’ll see from the click-through data (CTR) on the far right that we nailed it.
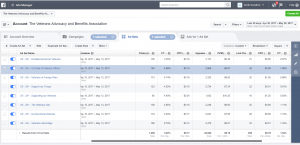
All campaigns were over .8% and more than half were over 1%. That’s really solid for a cold audience. 1% is actually good and can sometimes take a month or more to identify the right targeting if audiences are smaller, a lot of layering is needed, or drilling down to audiences who take action proves to be challenging.
So to run these total tests resulting in 255 clicks, we only had to spend $200 AND they were getting good traffic to the site already. This already drove conversions, built brand, and built up back-end audiences for retargeting purposes.
Now, we dug into the demographic results. Some agencies may start to split test out demographics right away, but we strongly recommend against it. Facebook does a great job of optimizing within broader, rather than narrower, audience sets, so the data you get back is much more robust.
As we can see, depending on the ad set, some skewed much more heavily towards men, some others towards women. Age was a clear stand out with age 45+ being primary among every ad set.

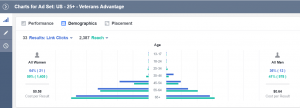
So now we know we need to focus targeting and create relevant copy based on those gender and age demographics.
Round Two: Testing Copy
Now that we’ve identified some key audiences, it’s time to test copy. For this, we pull out the top performing audiences from the previous split tests and then narrow down targeting to the demographics identified.
This time around, we can see we almost tripled conversions to cold audiences! That’s amazing. Cost-per-click was only 8-10 cents. Of course, again having Relevance scores of 10 for each ad helps a lot here.
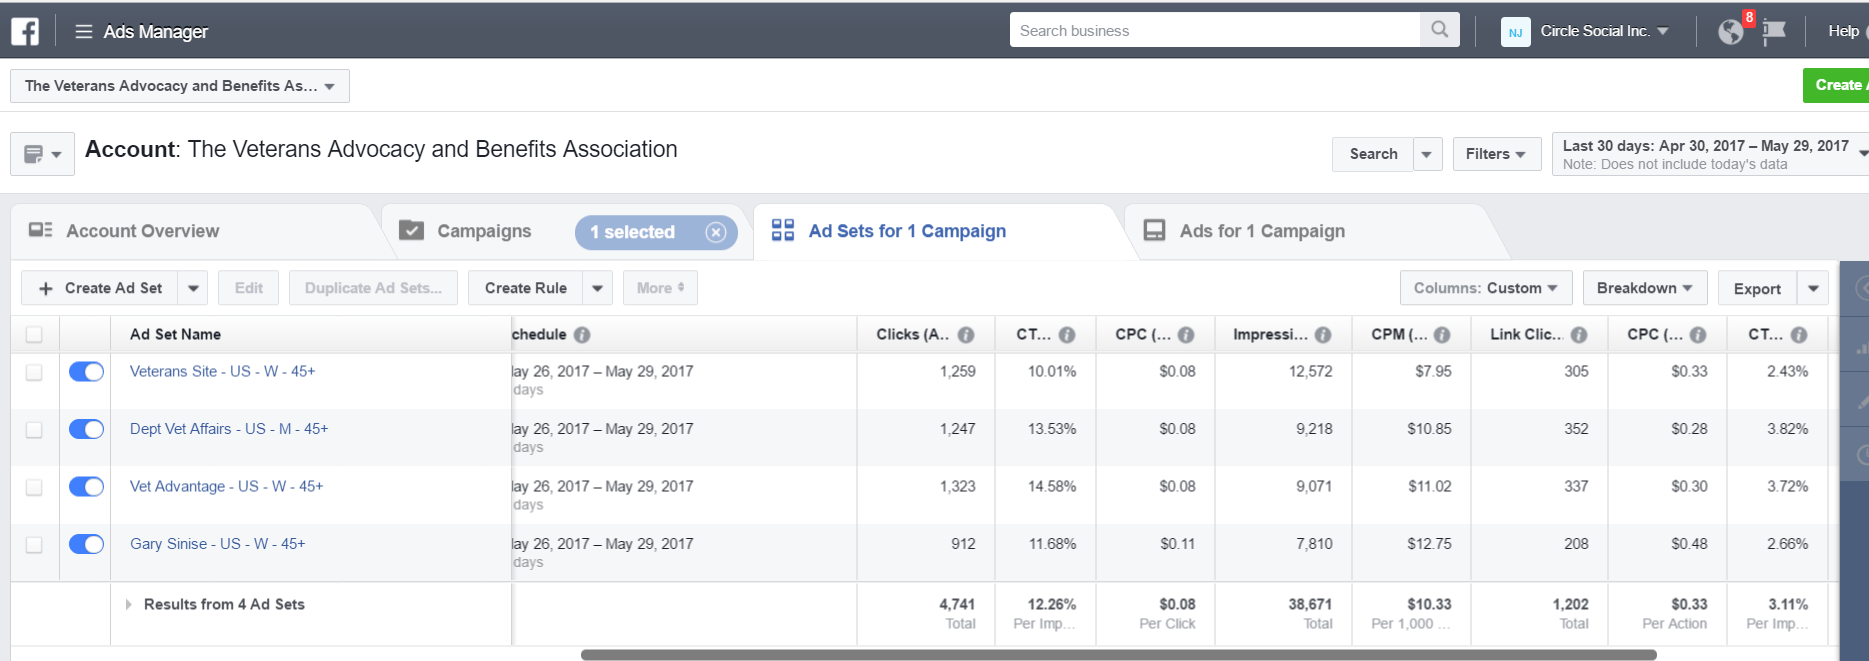
This time around, we put $100 behind each campaign as we already knew they would get north of 1% click-through-rates, so always above our targets. In this unique situation, we also wanted to up spend to capitalize on Memorial Day Weekend, which was very relevant to our client as an organization that supports our veterans.
We tested out the copy between short and long form. Generally speaking, long form means that audiences have to click on the ad/post to continue reading it. Short form means that the entire post will fit “above the fold” with no need to click.
For most of our clients, long form performs much better, often with 2-3X the conversion rates. However, as you can see below, short form actually did much better here, 3.92% vs. 1.61%. That’s a huge difference. Twice the number of clicks will logically mean twice the number of subscribers.
This is why it’s always important to test. There are no generic benchmarks or best practices that will apply across audiences.
You’ll also notice that both of these ads got a relevance score of 10, which is the highest you can get, so we were really performing at fully optimized levels. This tells us that additional split testing is largely unnecessary for these audiences.
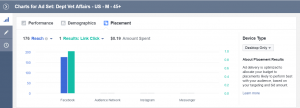
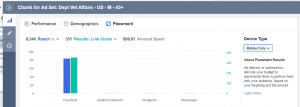
We also then dug further into placement and saw that mobile far outperformed desktop. As we can see below, only 1 click resulted from desktop while mobile had 351.
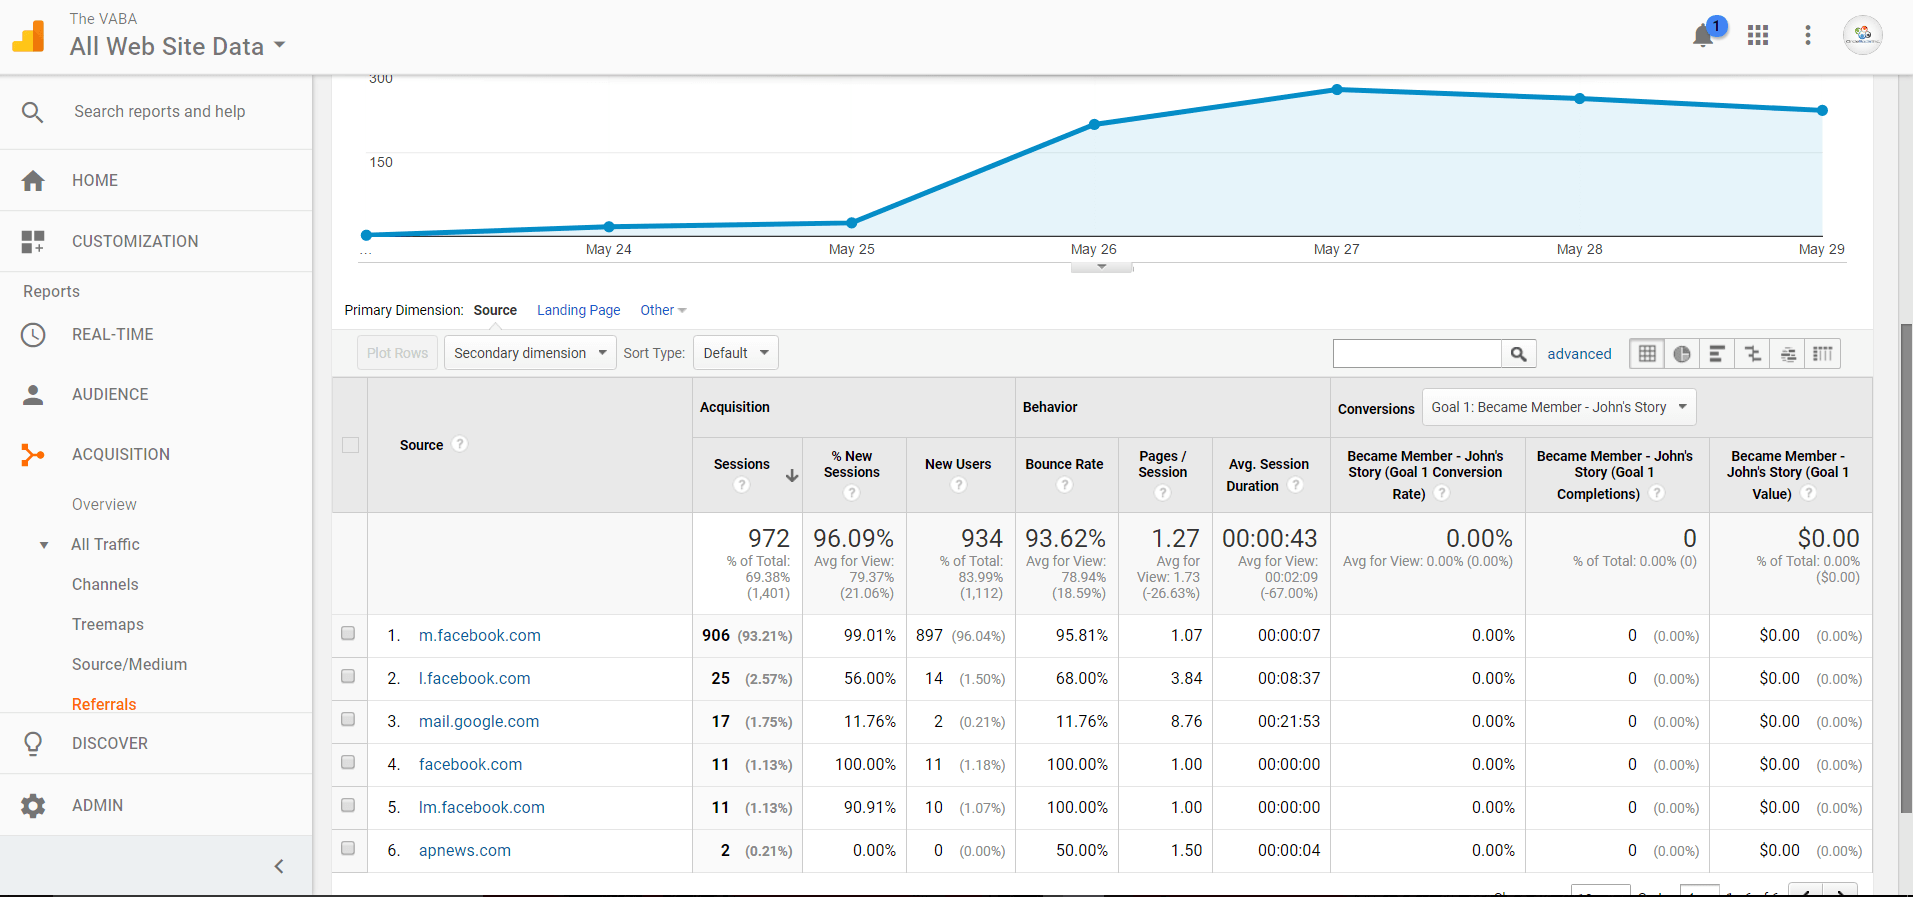
This was born out in Google Analytics as well with over 99% of traffic coming from mobile on Facebook (m.facebook.com).
Answering the Question, “Can We Scale It?”
Now we know that we want to:
- Target people 45+.
- Target them on mobile.
- Target our primary Pages connected to gender and with gender relevant copy.
- Use short form ads.
All of that from less than $600 in spend. We’ve now got another $9,400 to spend that we know will convert at over 3%!
The main question is if we can scale it or not. If we pump $1,000 into an a campaign that was previously only $100, will we oversaturate or burn out our audiences?
To know that, we have to look at audience size. As we can see from our cost per thousand impressions (CPMs), it costs us $11 on average to reach 1,000 people. So, with a $1,000 spend, we could potentially reach 90,909 people.
We then need to look at our audience sizes. As you can see below, we have a size of 840,00 people. So we could theoretically spend all $10,000 on just this audience set and just about reach everyone (Facebook will usually show your ad to the same person more than once. So, unless you optimize for Reach, you can assume you’ll only reach about 2/3rds of a target audience based off of a CPM calculation).
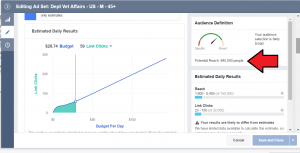
In a nice new feature, Facebook also gives you a graph to the left telling you the same thing. As long as we have a nice 45 degree angle there, we know we can scale up spend and Facebook predicts we will continue to see similar results.
Happy Scaling!
That’s it. That’s how you respect a client’s budget to get them maximum results even on large spends. We’ve got more than 90% of their spend left that is guaranteed to give them optimal value at the cheapest cost.
Now, I have to admit, I wish every client was as easy as this one. We’ve run campaigns where we needed to do over 50 split tests before identifying audiences and copy that converted at optimal rates. We were able to optimize the above in under a month, but it can take 3-6 if you’re in a really competitive or unique niche where targeting is not clear. And optimizing for small niche audiences or multiple differing audiences for more diverse product and service offerings is a topic for an entirely different blog post all together.
Additionally, this client was fortunate that cold conversions worked so well. Oftentimes, they simply won’t and you have to run extended campaigns that build up retargeting audiences over time through Awareness, Engagement, Action funnels. But the complexity of those campaigns and really cracking them to get results is what is so fun and enjoyable about our job.
Download Our FREE Facebook Campaign Benchmarks & Diagnostic
Even with all of this, how do you know if your Facebook campaigns are working? You’re spending all this money and the click through rate seems so low. We understand your pain. That’s why we created this really helpful diagnostic.
It outlines exactly what you should be expecting in terms of results and what defines a successful campaign, whether it’s number of link clicks, cost-per-click, or percentage of video views.
We’ll then give you are simple 3-part process for diagnosing and optimizing campaigns to get maximum results at the lowest cost. Just enter your name and email below to get it emailed immediately to your inbox.